
How to Look Up Lancaster County Jail Population Data
Start with the limit, because it saves time. The official county pages reviewed do not publish a live jail population dashboard. There is no county page that posts a current head count, a rated capacity, an average daily population, or a demographic breakdown for Lancaster County Prison. So a search for one clean local number will come up short. That gap is the most important fact on this page. It shapes every figure below.
What the county does run is a custody lookup, not a count. The Lancaster County Prison public inmate search shows individual people in current custody, with a PIN, name, birth date, race, sex, commit date and time, and the arresting agency. It is built to confirm whether one person is held, not to total the population. For aggregate jail figures, the better sources are national. The Bureau of Justice Statistics and the Prison Policy Initiative both publish jail data that puts a county like Lancaster in context.
Read each source for what it is. The county inmate search is current and operational, but it is a per-person tool. BJS data is national and state level, gathered on a survey cycle, so it runs a year or two behind. Research sources like Prison Policy build on that same federal data and add state pages. None of them gives a real-time Lancaster County total, and no official county page reviewed fills that gap.
Lancaster County Jail Capacity Overview
The county's main detention facility is Lancaster County Prison at 625 East King Street, Lancaster, PA 17602. It holds both pretrial detainees and people serving local sentences. New commitments move through intake, identification, medical screening, treatment screening, classification, and orientation before they reach a housing unit. That flow is documented on the prison's own pages.
What is not documented in any official source reviewed is a rated capacity or a current population for the facility. The county does not publish a bed count or a daily total in the pages checked for this build. So the table below lists the facility and its address, then marks the capacity and population fields as not published, rather than guessing at a number.
| Facility | Address | Rated Capacity | Current Population |
|---|---|---|---|
| Lancaster County Prison | 625 East King Street, Lancaster, PA 17602 | Not published | Not published |
Note: Lancaster County does not post a jail population dashboard, so the capacity and daily count shown here are marked not published rather than estimated.
Average Daily Population for Lancaster County
Average daily population, often shortened to ADP, is the mean number of people held across a set period, usually a year. It smooths out day-to-day swings and is the figure most jails report for budgets and planning. For Lancaster County, no official source reviewed publishes an ADP for the local jail.
Because the county does not release that number, this page will not invent one. A year-over-year ADP change would need a published baseline, and none was located. Counties that do report ADP usually do so through a prison board, an annual budget, or a state inspection report. If Lancaster County later posts one of those, the figure would belong here. For now, the state and national context below is the closest reliable read on how crowded a county jail like this tends to run.
Lancaster County Jail Demographic Breakdown
A demographic breakdown sorts the jail population by traits like sex, race, and age. The Lancaster County public inmate search does carry some of these fields on each record. Each custody result shows a race value, a sex value, and a commit age figured from the birth date and the commit date. So the data points exist at the individual level.
They are not totaled anywhere public, though. The county does not publish a demographic summary of who is held in the jail. There is no official table that gives the share of the population by sex, by race, or by age band. The per-record fields are built for custody lookups, not for counting. The table below shows the demographic fields the inmate search carries, with the population share marked not published since the county does not aggregate them.
| Demographic Field | Source | Share of Population |
|---|---|---|
| Sex | Inmate search record | Not published |
| Race | Inmate search record | Not published |
| Age at commitment | Calculated from birth and commit date | Not published |
For a true demographic profile of jails, federal data fills the gap. BJS reports race and sex breakdowns at the national level in its jail inmate series, which is the right source when no county figure exists.
Lancaster County Pretrial vs Sentenced Population
Local jails hold two broad groups. One group is pretrial, meaning people held while their case is open and not yet resolved. The other group is sentenced, meaning people serving a term after a conviction, usually a shorter sentence that stays in county custody. The split between the two is a key measure of how a jail is used.
Lancaster County does not publish that split for its jail. No official source reviewed gives the share that is pretrial versus the share that is sentenced. So the table marks both rows as not published. The national pattern is well documented, though. BJS and the Prison Policy Initiative both report that most people in local jails across the country are held pretrial, not serving a sentence. That national finding is the best available frame for a county that does not release its own number.
| Status | Lancaster County Share |
|---|---|
| Pretrial | Not published |
| Sentenced | Not published |
Lancaster County Misdemeanor vs Felony Population
Another way to slice a jail count is by charge grade. Some people are held on misdemeanor matters and some on felony matters, and the mix tells you something about who fills the beds. The county does not publish this split for Lancaster County Prison.
The reason ties back to how the data is kept. Charge grade lives on the court docket, not in the public inmate search. The inmate search shows the arresting agency and commit date, but not the grade of the offense. To see the charges behind a single person's custody, you would read the court case in the statewide docket system. To count grades across the whole jail, you would need a published report the county does not put out. So no misdemeanor or felony share can be stated here without inventing it.
Mental Health and Medical Population
Jails carry a real medical and mental health load. Lancaster County Prison screens every new commitment for medical and treatment needs during intake, and a preliminary physical exam is mandatory shortly after commitment. So the jail does collect this information at booking. Treatment staff meet with each new inmate to gather treatment details as part of that process.
None of that becomes a public count. The county does not publish how many people in the jail are receiving mental health or medical care. Those screening details are internal correctional records, not public fields in the inmate search. For scale at a wider level, BJS jail reports cover the share of jail populations with treatment needs nationally, which again is the fallback when a county does not release its own figure.
National and State Context for Jail Population
When a county will not share a number, national and state data is the honest substitute, as long as the labels stay clear. The Bureau of Justice Statistics is the federal agency that gathers jail and prison counts across the country. Its jail inmate reports give a national incarceration rate per 100,000 residents and break that down by state. Those figures are national and state level, not specific to Lancaster County.
The lead-in to its data is the agency's own site, which hosts the reports behind these rates.
You can reach the federal jail data on the Bureau of Justice Statistics site, which publishes the national jail inmate series.
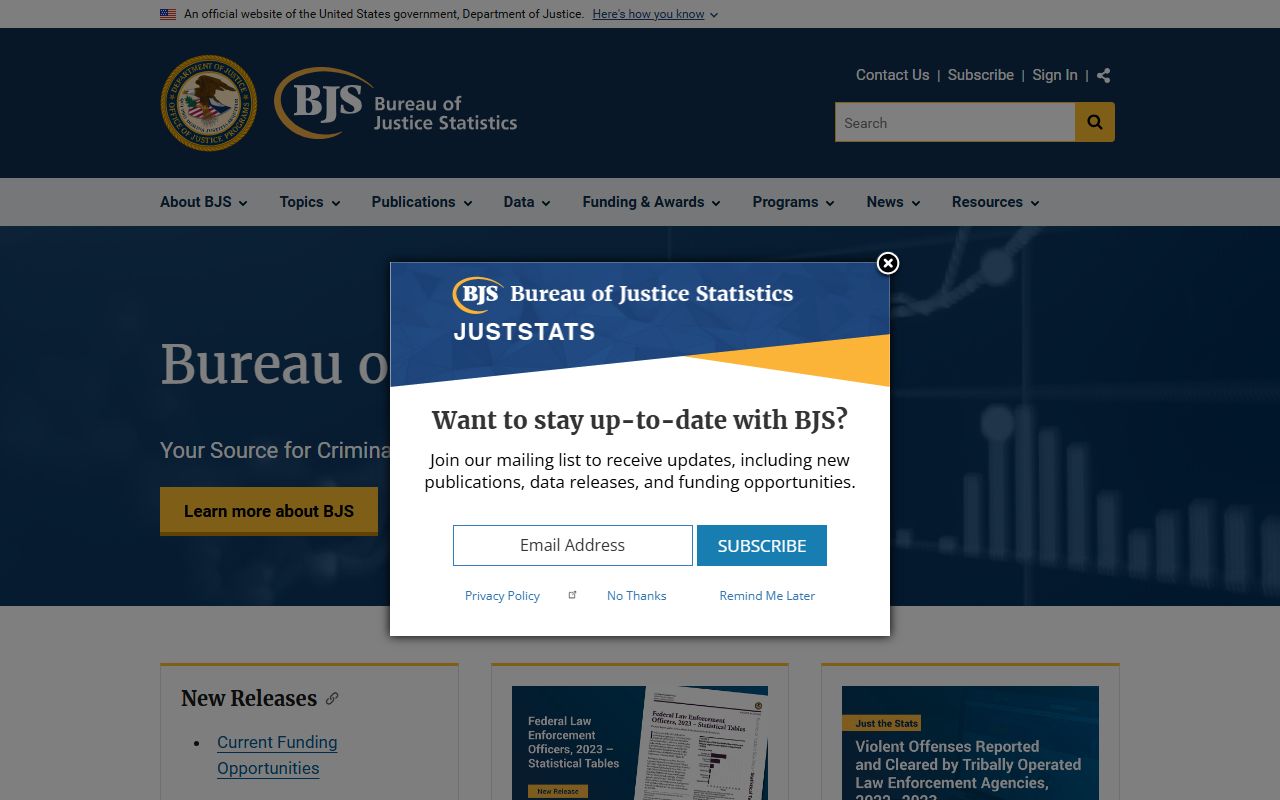
The BJS reports there give the national jail rate and a state-by-state view, which is why they stand in for a county figure the local pages do not publish.
The Prison Policy Initiative builds on that same federal data and adds state pages, including Pennsylvania. It is a research nonprofit, not a government office, so its numbers should be read as analysis of public data rather than an official county count.
Its state and national figures sit on the Prison Policy Initiative site, which tracks incarceration by state.

That source helps frame where Pennsylvania sits against the national rate, even though it does not isolate the Lancaster County jail on its own.
The table puts the three levels side by side. Read the county row carefully. The county rate is not published, so only the state and national context can be cited, and each is clearly labeled by source.
| Level | Jail Population per 100k | Source |
|---|---|---|
| Lancaster County | Not published | No county dashboard located |
| Pennsylvania | See current state figure | BJS / Prison Policy state data |
| National | See current national figure | BJS jail inmate series |
The state and national cells point to live BJS and Prison Policy data rather than a fixed number, because those rates shift each reporting cycle. The county cell stays empty for the same reason it does throughout this page. The local count is simply not put out.
Population Trends Over Time
A trend table needs a run of years to mean anything. For Lancaster County, no official five-year jail population table was located in the sources reviewed. The county does not post a year-by-year count, so a local trend line cannot be drawn here without making numbers up.
There are places such a record could surface later. County budgets, prison board minutes, and Pennsylvania jail inspection reports sometimes carry historical counts. If one of those publishes a multi-year series for Lancaster County Prison, that data would belong in this section. Until then, the national trend is the only sourced read. BJS tracks jail counts across years at the national level, which shows broad direction even when a single county stays silent.
Searching for Lancaster County Inmate Records by Name
This page covers aggregate jail population data, not lookups of one person. To check whether a named individual is in current county custody, use the live roster on the Lancaster County inmate records page, which explains the public inmate search and its fields.
Where the Lancaster County Jail Population Data Comes From
Three kinds of sources sit behind this page, and it helps to keep them apart. The first is the county itself. Lancaster County Prison runs the public inmate search and posts its intake process, but it does not publish a population dashboard. That is why so many cells above read not published. The county tool answers who is in custody now, one record at a time, not how many.
The second source is the Sheriff's Office, which shapes jail flow without counting the population. The Lancaster County Sheriff's Office transports about 600 prisoners a year within Pennsylvania and about 100 a year from outside the state back to the county. Its warrant work is large: roughly 4,000 Court of Common Pleas bench warrants under oversight, about 65,000 traffic and non-traffic Magisterial District Court warrants, and around 4,500 warrants served per month. Those numbers move people in and out of intake, so they explain why a jail count would swing, even though they are not a population figure themselves.
The third source is federal and research data. The Bureau of Justice Statistics gathers national and state jail counts on a survey cycle, and the Prison Policy Initiative turns that public data into state pages and analysis. Use the first two sources for what is local and current. Use the third for scale and rates. To see custody status for one person, go to inmate records; to track people leaving the jail, see released inmates; and for the warrant volume that feeds intake, see warrant records or the broader arrest records page.